Selecting the correct water pump for your application requires more than matching a flow rate and power rating from a catalog. Proper pump selection flow head calculation involves understanding performance curves, calculating system resistance, verifying NPSH margins, and confirming the operating point falls within the pump’s efficient range. Getting any of these steps wrong leads to wasted energy, premature failure, or a system that simply cannot meet demand.
This technical guide covers every parameter you need to evaluate, with worked calculation examples you can apply directly to your projects. Whether you are designing an HVAC system, specifying a building water supply, or selecting industrial process pumps, these principles form the foundation of correct pump engineering.
What a Pump Performance Curve Tells You
A pump performance curve — also called a characteristic curve — is a graph showing the relationship between flow rate and several critical parameters at constant operating speed. Every pump manufacturer publishes these curves, and reading them correctly is essential for proper equipment selection.
The curve typically displays four parameters plotted against flow rate: head, efficiency, power consumption, and NPSH required. Understanding how these four parameters interact is the key to intelligent pump selection.
The Q-H Curve: Flow Rate Versus Head
The Q-H curve is the primary characteristic of any centrifugal pump. It shows that as flow rate increases, the head the pump can generate decreases. At zero flow — the shut-off condition — the pump produces its maximum head. As the discharge valve opens and flow increases, head drops progressively.
The shape of this curve depends on the pump’s specific speed and impeller design. Steep curves indicate pumps suited for systems with highly variable head requirements, while flat curves suit applications needing relatively constant head across a range of flows. Importantly, a pump should never operate continuously at or near zero flow, as the input energy converts entirely to heat and can damage the pump internals.
The Best Efficiency Point, commonly abbreviated as BEP, typically occurs at 70% to 110% of the pump’s rated flow. Selecting your operating point near BEP ensures maximum energy efficiency and minimum vibration.
The Q-Efficiency Curve: Finding Your Sweet Spot
The efficiency curve rises from zero at no flow, reaches a peak at the Best Efficiency Point, and then declines at higher flows. The high-efficiency zone — where efficiency remains within 5 to 10% of the peak value — represents the recommended operating range for the pump.
Operating far from BEP in either direction causes problems. Low-flow operation increases radial thrust on the impeller, accelerates bearing wear, and generates excessive vibration and noise. High-flow operation beyond the efficiency zone can lead to motor overload, cavitation, and premature seal failure. Always verify that your selected operating point falls comfortably within the high-efficiency zone.
The Q-Power Curve: Sizing Your Motor Correctly
The power curve shows how electrical power consumption changes with flow rate. For radial-flow centrifugal pumps — the most common type — power consumption increases as flow increases. This means the motor draws its maximum power at maximum flow.
Motor sizing must account for the worst-case power demand. Always select a motor rated for the power requirement at the right end of the pump curve, plus a 10% to 15% safety margin. Undersized motors will overheat and trip under high-flow conditions. Oversized motors waste energy and operate at poor power factors during normal conditions.
The NPSHr Curve: Preventing Cavitation Damage
NPSH required represents the minimum absolute pressure that must exist at the pump inlet to prevent cavitation. As flow increases, NPSHr also increases — higher flow rates demand more inlet pressure. If the available NPSH at your installation falls below the required NPSH, vapor bubbles form inside the pump, collapse violently, and progressively destroy the impeller surface.
Cavitation damage is irreversible and can destroy an impeller within weeks or even days of continuous operation. The noise signature of cavitation — a distinctive gravel-like sound from the pump — should trigger immediate investigation.
Step-by-Step Pump Selection Flow Head Calculation
Step 1: Determine Your Required Flow Rate
Flow rate depends on your application. For building water supply, calculate based on the number of fixtures, simultaneous demand factors, and peak usage patterns. For HVAC systems, flow rate is determined by the cooling or heating load divided by the temperature difference across the system. For industrial processes, flow rate is set by the production requirement.
Step 2: Calculate Total System Head
Total system head is the sum of all resistance elements the pump must overcome:
Static Head is the vertical elevation difference between the water source and the highest discharge point. This component is constant regardless of flow rate.
Pipe Friction Losses increase proportionally to the square of flow velocity. Use the Darcy-Weisbach equation or equivalent length methods to calculate friction losses in straight pipe sections. For typical commercial installations, friction losses range from 1 to 5 meters per 100 meters of pipe.
Fitting Losses from elbows, tees, valves, and reducers also increase with flow squared. The equivalent length method converts each fitting into an equivalent length of straight pipe for simplified calculation.
Equipment Losses include pressure drops through heat exchangers, chillers, filters, and other components in the system. These values are typically provided by the equipment manufacturer.
Safety Margin of 10% to 15% should be added to the calculated total head to account for aging pipes, fouled heat exchangers, and future system modifications.
Step 3: Worked Calculation Example
Consider a building water supply system with the following parameters:
- Water tank on the roof at 30 meters above pump level
- Suction lift of 3 meters from underground tank
- Total pipe length of 80 meters with DN80 diameter
- Six elbows, two tees, two gate valves, and one check valve
- End-use equipment requiring 2 bar (20 meters) of residual pressure
The calculation proceeds as follows. Static discharge head is 30 meters, suction lift adds 3 meters, pipe friction losses at the design flow velocity total approximately 4.2 meters, fitting equivalent losses amount to 3.8 meters, the check valve contributes 1 meter, and end-use pressure adds 20 meters. The subtotal reaches 62 meters. Applying a 15% safety margin of 9.3 meters gives a total design head of 71.3 meters. You would select a pump rated for at least 72 meters of head at your required flow rate.
Step 4: Plot the System Curve and Find the Operating Point
The system curve is a parabolic relationship between flow and head. At zero flow, the system head equals the static head alone. As flow increases, friction and fitting losses increase with the square of flow, causing the system curve to rise steeply.
When you overlay the system curve on the pump’s Q-H curve, the intersection point is your operating point. This is the exact combination of flow and head that your system will deliver with that specific pump. Verify that this intersection falls within the pump’s high-efficiency zone and that motor power is adequate at this point.
Step 5: Verify NPSH Margin
Calculate the NPSH available at your installation using this formula. NPSHa equals atmospheric pressure minus vapor pressure of the liquid at operating temperature, plus or minus suction static head, minus friction losses in the suction pipe.
For a typical installation at sea level with 20°C water and a 3-meter suction lift, NPSHa equals approximately 6.29 meters. If the pump’s NPSHr at your design flow is 4.5 meters, the margin is 1.79 meters — adequate for reliable operation. A minimum margin of 0.5 meters is required, but margins of 1.0 meters or more are strongly recommended for continuous-duty applications.
Common Mistakes in Pump Selection
The most frequent error is oversizing the pump. Engineers often add excessive safety margins at every stage of calculation, resulting in a pump far larger than necessary. An oversized pump operates at low flow on its curve, wasting energy, creating excessive vibration, and cycling frequently. Always base your calculations on realistic demand, not worst-case scenarios stacked on top of each other.
Ignoring NPSH requirements is another dangerous mistake. Cavitation may not cause immediate failure, but it progressively damages the impeller and reduces pump performance. Always calculate NPSHa and verify adequate margin before finalizing pump selection.
Failing to consider the full range of operating conditions leads to problems as system conditions change. Filters clog over time, control valves adjust, and seasonal loads vary. A pump selected only for design-day conditions may perform poorly during partial-load operation, which represents the majority of operating hours.
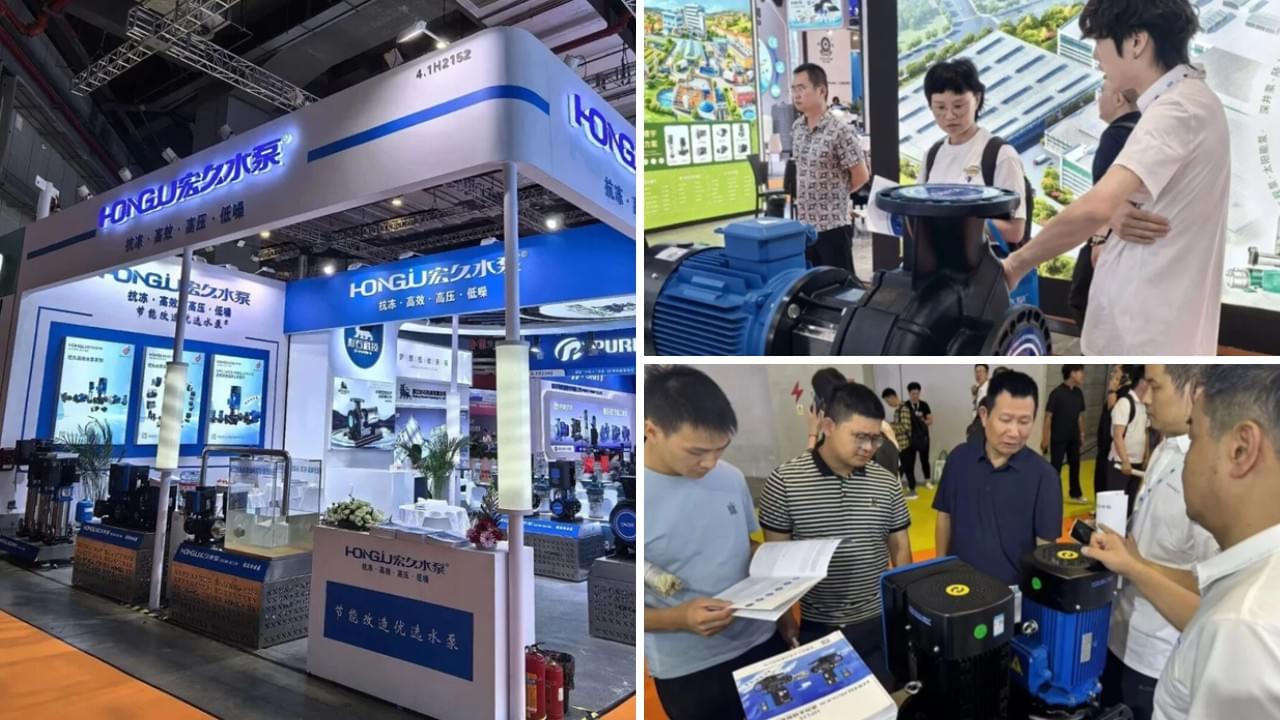
How Hongjiu Supports Your Pump Selection
Every Hongjiu pump model ships with a complete performance curve tested on our GB/T 3216-2016 standard hydraulic test bench. Our curves are verified from actual testing — not theoretical calculations — and carry a guaranteed tolerance of plus or minus 3%.
We test 100% of production before shipment, so the performance data on your curve is the performance you will actually get. Complete performance curves for all models are available in our product catalog with detailed test data points.
Our engineering team provides complimentary pump selection support. Send us your system parameters, and we will calculate the system curve, identify the optimal pump model, verify NPSH margins, and confirm the operating point falls within the efficient range. This service is free for all serious project inquiries.
For more technical resources on pump system design and fluid mechanics calculations, The Engineering ToolBox provides extensive reference data including pipe friction factors, fluid properties, and system design guidelines that complement this guide.
Practical Tips for Accurate Calculations
Always use actual pipe lengths — not estimated values — when calculating friction losses. Small errors in pipe length multiply into significant head calculation errors. Account for future pipe fouling by applying appropriate safety margins, but avoid the temptation to double or triple your margin, which leads to oversizing.
When selecting pumps for variable-load systems, consider the full load profile rather than just the peak condition. HVAC systems typically operate at 40-75% of peak load for most of the year. Selecting a pump that operates efficiently at partial loads saves more energy than one optimized only for peak conditions.
Verify voltage and frequency at your installation site. Pump performance depends on operating speed, which depends on the electrical supply frequency. A 50 Hz pump running on 60 Hz power will produce 20% more flow and 44% more head — or overload the motor if it is not sized accordingly.
Key Formulas Reference
Total system head: Static head plus friction losses plus fitting losses plus equipment losses plus safety margin.
NPSH available: Atmospheric pressure minus vapor pressure plus suction head minus suction friction losses.
Motor power: Pump shaft power divided by motor efficiency, with a 10-15% safety factor.
Flow velocity: Volumetric flow rate divided by pipe cross-sectional area.
Annual energy consumption: Pump power in kilowatts multiplied by annual operating hours.
Understanding and applying these calculations correctly ensures you select a pump that delivers reliable, efficient performance throughout its service life. Poor pump selection is expensive to correct after installation — the cost of an undersized or oversized pump compounds every day the system operates.
Ready to put these calculations into practice? Explore our HK(L) Vertical Multistage Pump and HL Horizontal Multistage Pump series with complete performance curves and technical specifications. Contact our engineering team with your system parameters for a complimentary pump selection analysis, and request our full product catalog with detailed test data for every model.